# Load OTU table
load("RData/16S/otu_rare_clean.RData")

# Load packages and homemade functions
source("001_required_packages.R")
BLAST quality check
Filtering based on BLAST accuracy is applied to remove OTUs with low-confidence taxonomic assignments, typically indicated by low sequence similarity (pident), poor alignment coverage (qcovs), or poor fit of the rank resolution (evalue)[1]. Such features are frequently artefactual or biologically uninterpretable and can bias ecological inference if retained.
| Column name | Definition |
|---|---|
| query_seq | DNA sequence |
| X1st_hit | first BLAST hit: best match against the database |
| qlen | query length: length of the DNA sequence |
| slen | length of the matching sequence in the database |
| qstart | start point on the query sequence that matches with the database sequence |
| qend | end point on the query sequence that matches with the database sequence |
| sstart | start point on the database sequence that matches with the query sequence |
| send | end point on the database sequence that matches with the query sequence |
| evalue | summary statistic that estimate the goodness of match between the query and database sequences |
| length | length of the match between the query and database sequences |
| nident | number of pairbase that match within the matching length |
| mismatch | number of pairbase that do not match within the matching length (length - nident) |
| gapopen | number of gap openings |
| gaps | gap size: number of pairbase inside gaps |
| sstrand | orientation of the database sequence (plus or minus) |
| qcovs | percentage of coverage of the query sequence over the database sequence (length/qlen) |
| pident | percentage of identity between the two sequences (nident/length) |
This section documents how to filter OTUs based on BLAST results (see table above), and clean the taxonomy assignations based on BLAST accuracy, in phyloseq objects. To follow the example presented on this page directly on your computer, download the script 005_BLAST_filter.R and the example raw data by clicking the buttons below. Alternatively, you may copy the codes below into your own script, and use your own data.
To get started on this demonstration, load the necessary data and source the script 001_required_packages.R to load the homemade function remove_taxa.
BLAST filtering
Filtering out OTUs based on BLAST results is normally done during bioinformatic processing, but if it was not the case for your OTU table, simple filters can be used to further remove artefacts.
Depending on primers, the expected length of amplicons varies greatly, thus it is impossible to determine a universal threshold for sequence length. However, most studies set this threshold to rougly half of the expected length (see table below).
| Name | Target | Primers (sequence 5’-3’) | Regions | Length (average) |
Threshold query length | References |
|---|---|---|---|---|---|---|
| 16S | Prokaryotes (Bacteria and Archaea) | 515F-Y (GTGYCAGCMGCCGCGGTAA) 926RB (CCGYCAATTYMTTTRAGTTT) |
V4-V5 | 360-500 bp (~460 bp) |
250 bp | [2] |
| ITS | Fungi | ITS9MUN (TGTACACACCGCCCGTCG) ITS4ngsUni (CCTSCSCTTANTDATATGC) |
ITS1-ITS2 | 150-1200 bp (~280 bp) |
100 bp | [3] |
| CO1 | Metazoa | mlCOIintF (GGWACWGGWTGAACWGTWTAYCCYCC) jgHCO2198 (TAIACYTCIGGRTGICCRAARAAYCA) |
320-345 658 |
250-700 (~313 bp) |
200 bp | [4,5] |
Alternatively, some studies also suggest to filter out sequences with less than 15% query coverage (qcovs), which are assumed to be fully synthetic[6]. In these cases, even tough the query sequence may be large, if it has such a low alignment with the sequences in the database, it cannot be considered natural.
This demonstration is done with the 16S data, and we choose to remove sequences with a length (qlen) shorter than 250 bp or a query cover (qcovs) smaller than 15%.
Note that the threshold at a query cover of 15% was determined arbitrarily. The authors denote: “This was guided by not wanting to pick too high a level, lest we exclude natural sequences […]. Similarly, we did not want to pick too low a level, since BLASTn searches preferentially for highly identical regions, and thus might cut off the end of a synthetic sequence yielding a maximal-scoring segment pair with lower query coverage and higher percentage identity (thus falsely classified as natural)”[6].
Tipremove_taxa
Homemade function remove_taxa: a simplified way of removing a selection of OTU from a phyloseq object.
remove_taxa <- function(badTaxa, physeq){
  allTaxa <- taxa_names(physeq)
  cleanTaxa <- allTaxa[!(allTaxa %in% badTaxa)]
  return(prune_taxa(cleanTaxa, physeq))
}
# Extract BLAST results from OTU table
BLAST_rare <- as.data.frame(otu_table_rare@tax_table) %>%
# Convert column class automatically
type.convert(as.is = TRUE)
# Identify synthetic sequences based on BLAST results
otu_qlen <- filter(BLAST_rare, qlen < 250)[["taxa_OTU"]] # no sequence identified
otu_qcovs <- filter(BLAST_rare, qcovs < 15)[["taxa_OTU"]] # no sequence identified
# Filter synthetic sequences
BLAST_filter <- filter(BLAST_rare, !taxa_OTU %in% c(otu_qlen, otu_qcovs))
otu_BLAST_filter <- remove_taxa(c(otu_qlen, otu_qcovs), otu_table_rare)
# Count OTUs before and after filtering
ntaxa(otu_table_rare) # 8064
ntaxa(otu_BLAST_filter) # 8064In this demonstration, we found no sequences that were either too short or had a poor alignment. These were either previously removed during bioinformatic processing or while filtering out singletons or rare OTUs.
With your own data, if you identify potential artefacts this way, inspect them before removing them to make sure that they are indeed artefacts.
BLAST cleaning
After filtering out any remaining potential artefacts, BLAST statistics (such as pident and evalue) can also be used to confirm taxonomic assignations. At this stage, OTUs are not removed, as they are not considered artefacts anymore, but simply unknown species. This means that, based on specific thresholds for each target gene and taxonomic rank (Table 3), any taxonomic assignation below these thresholds is replaced with NA.
Unknown organisms
There are a few exceptions to this rule. As a rule of thumb (arbitrary thresholds):
- Any OTU with an identity (
pident) below 70% cannot be identified, even up to the kingdom level[7]. - Any OTU with an e-value (
evalue) above e-20 cannot be identified, even up to the kingdom level[7]. - Any OTU with a query coverage (
qcovs) below 50% must be investigated[6]. - OTUs with an e-value between e-20 and e-50 should be manually checked against the 10 best BLAST matches for accurate assignment[7].
These OTUs should be further investigated to determine if they should be removed or preserved.
# Identify unknown OTUs
BLAST_unknown <- filter(BLAST_filter, pident < 70 | evalue > 1e-50 | qcovs < 50)
View(BLAST_unknown)
A manual BLASTn search of these 44 OTUs revealed that some of them could not be confidently identified as Bacteria and should be removed. The rest of the OTUs could not be assigned a higher taxonomic level than kingdom.
# Identify OTUs to remove after manual BLASTn
otu_BLAST_remove <- c("1d27c83d9692aab8c80bf374e70e6bd36ab107db",
                      "97fd840ad5b43b3e40763cb0f286c7f12482b5aa",
                      "a247774bebc7f5d0d55919174fa28717fde309c0",
                      "b32bc6dc7e56daabd7cbb16d6e64d75f5bbf1be7",
                      "c2273056078eeba2d2a2efc1cb351e5290d7bb91",
                      "fc6386fb30284b857e60f04b2101e43d368f60a1",
                      "501c4d4b723af4468417d493ca4fadbb1d6bfe4c",
                      "8767164c7b5703151beba4829286c69a6124f4e4")

# Identify OTUs that should only be assigned to the kingdom level
otu_BLAST_assign <- setdiff(BLAST_unknown[["taxa_OTU"]], otu_BLAST_remove)
Before removing OTUs, let’s check their abundance and prevalence across samples:
# Filter OTU table to keep manually BLASTed OTUs to remove
otu_table_BLAST_remove <- prune_taxa(otu_BLAST_remove, otu_BLAST_filter)

# Visualize the abundance and prevalence of these OTUs across samples
plot_bar(otu_table_BLAST_remove, fill = "OTU")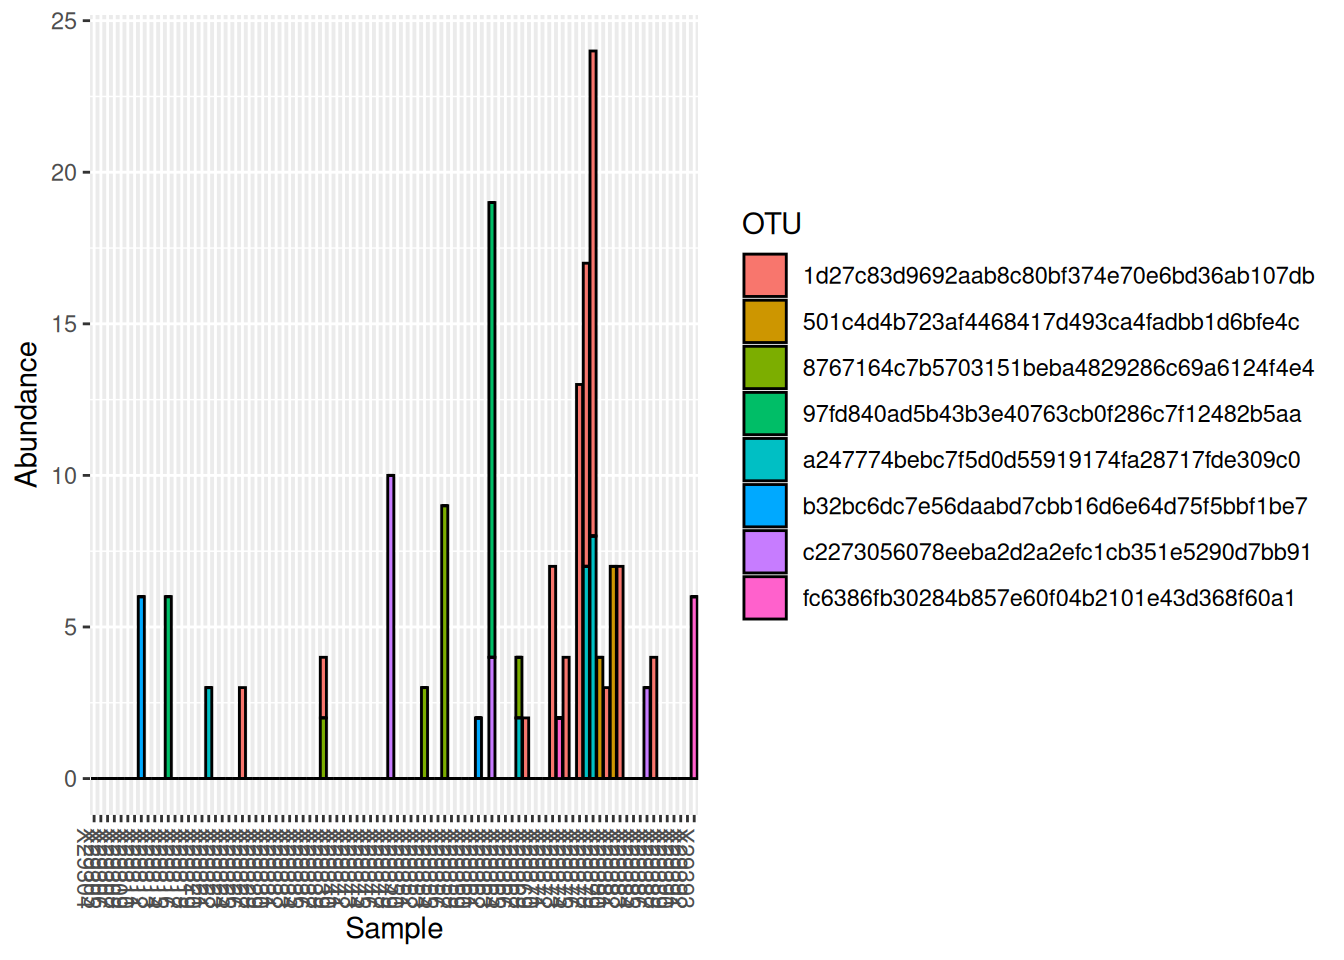
All OTUs identified are both scarce (low prevalence) and rare (low abundance), thus removing them will not affect community analyses.
# Remove remaining non-bacterial OTUs
BLAST_filter2 <- filter(BLAST_filter, !taxa_OTU %in% otu_BLAST_remove)
otu_BLAST_filter2 <- remove_taxa(otu_BLAST_remove, otu_BLAST_filter)
Rank-level confidence
Now that we are confident about our OTU selection, it is time to clean the taxonomy assignation. BLASTn searches preferentially for highly identical regions, and thus might cut off the ends of a synthetic sequence (not a real 16S fragment) yielding a maximal-scoring segment pair with lower query coverage and higher percentage identity, thus falsely classifying it as a real 16S match. Therefore, we must verify the pident to decide if we can trust the BLAST results. The table below summarizes thresholds for each target gene and taxonomic rank found in the literature.
| Taxonomic rank | ITS (cons.) |
ITS (rot) |
16S (cons.) |
CO1 (cons.) |
CO1 (cons.) |
|---|---|---|---|---|---|
| Kingdom | 70[8] | ||||
| Phylum | 75[8] | 75.0[9] | 78*[10] | 85[11] | |
| Class | 80.9[12] | 75[7] | 78.5[9] | 78*[10] | 90[13] |
| Order | 81.2[12] | 80[7] | 82.0[9] | 87*[10] | 92[13] |
| Family | 88.5[12] | 85[7] | 86.5[9] | 90†[10] | 96[13] |
| Genus | 94.3[12] | 90[7] | 94.5[9] | 95†[10] | 98[13] |
| Species | 98[14] | 98.7[15] | 98†[10] | 100[13] |
Based on the thresholds identified in Table 3, any taxonomic assignation below these thresholds will be changed to NA. For example, for an OTU identified to the species level, but that only has a pident of 95%, there is no certainty on the taxonomic assignation up to that rank. However, a pident of 95% allows for certainty up to the genus level. Thus, for this OTU, we would simply remove the assignation at the species level (replace it with NA) and preserve the other ranks.
# Clean the OTU table based on taxonomy thresholds
# (remove assignation if confidence is too low).
BLAST_clean <- BLAST_filter2 %>%
  mutate(species = if_else(pident < 98.7, "NA", species),
         genus = if_else(pident < 94.5, "NA", genus),
         family = if_else(pident < 86.5, "NA", family),
         order = if_else(pident < 82.0, "NA", order),
         class = if_else(pident < 78.5, "NA", class),
         phylum = if_else(pident < 75.0, "NA", phylum)) %>%
  # Remove uncultured assignation
  mutate(across(phylum:species, ~ gsub(".*uncultured.*", "NA", .x))) %>%
  # Remove metagenome assignation
  mutate(across(phylum:species, ~ gsub(".*metagenome.*", "NA", .x))) %>%
  # Remove assignation above kingdom for previously identified OTUs
  mutate(across(phylum:species, ~ if_else(taxa_OTU %in% otu_BLAST_assign, "NA", .x)))
The cleaned taxonomy table (BLAST_clean) should now be put back into the OTU table (phyloseq object).
# Replace taxonomy table in the phyloseq object
otu_BLAST_clean <- otu_BLAST_filter2
otu_BLAST_clean@tax_table <- tax_table(as.matrix(BLAST_clean))
Clean and save OTU table
# OTU table with cleaned taxonomy, based on BLAST accuracy
save(otu_BLAST_clean, file = "RData/16S/otu_BLAST_clean.RData")
References
1. Tedersoo, L., Bahram, M., Zinger, L., Nilsson, R. H., Kennedy, P. G., Yang, T., Anslan, S., & Mikryukov, V. (2022). Best practices in metabarcoding of fungi: From experimental design to results. Molecular Ecology, 31(10), 2769–2795. https://doi.org/10.1111/mec.16460
2. Parada, A. E., Needham, D. M., & Fuhrman, J. A. (2015). Every base matters: assessing small subunit rRNA primers for marine microbiomes with mock communities, time series and global field samples. Environmental Microbiology, 18(5), 1403–1414. https://doi.org/10.1111/1462-2920.13023
3. Tedersoo, L., & Lindahl, B. (2016). Fungal identification biases in microbiome projects. Environmental Microbiology Reports, 8(5), 774–779. https://doi.org/10.1111/1758-2229.12438
4. Leray, M., Yang, J. Y., Meyer, C. P., Mills, S. C., Agudelo, N., Ranwez, V., Boehm, J. T., & Machida, R. J. (2013). A new versatile primer set targeting a short fragment of the mitochondrial COI region for metabarcoding metazoan diversity: application for characterizing coral reef fish gut contents. Frontiers in Zoology, 10(1), 34. https://doi.org/10.1186/1742-9994-10-34
5. Geller, J., Meyer, C., Parker, M., & Hawk, H. (2013). Redesign of PCR primers for mitochondrial cytochrome c oxidase subunit I for marine invertebrates and application in all-taxa biotic surveys. Molecular Ecology Resources, 13(5), 851–861. https://doi.org/10.1111/1755-0998.12138
6. Kunjapur, A. M., Pfingstag, P., & Thompson, N. C. (2018). Gene synthesis allows biologists to source genes from farther away in the tree of life. Nature Communications, 9(1). https://doi.org/10.1038/s41467-018-06798-7
7. Tedersoo, L., Bahram, M., Põlme, S., Kõljalg, U., Yorou, N. S., Wijesundera, R., Ruiz, L. V., Vasco-Palacios, A. M., Thu, P. Q., Suija, A., Smith, M. E., Sharp, C., Saluveer, E., Saitta, A., Rosas, M., Riit, T., Ratkowsky, D., Pritsch, K., Põldmaa, K., … Abarenkov, K. (2014). Global diversity and geography of soil fungi. Science, 346(6213). https://doi.org/10.1126/science.1256688
8. Tedersoo, L., & Anslan, S. (2019). Towards PacBio-based pan-eukaryote metabarcoding using full-length ITS sequences. Environmental Microbiology Reports, 11(5), 659–668. https://doi.org/10.1111/1758-2229.12776
9. Yarza, P., Yilmaz, P., Pruesse, E., Glöckner, F. O., Ludwig, W., Schleifer, K.-H., Whitman, W. B., Euzéby, J., Amann, R., & Rosselló-Móra, R. (2014). Uniting the classification of cultured and uncultured bacteria and archaea using 16S rRNA gene sequences. Nature Reviews Microbiology, 12(9), 635–645. https://doi.org/10.1038/nrmicro3330
10. Pappalardo, P., Hemmi, J. M., Machida, R. J., Leray, M., Collins, A. G., & Osborn, K. J. (2025). Taxon-specific BLAST percent identity thresholds for identification of unknown sequences using metabarcoding. Methods in Ecology and Evolution, 16(10), 2380–2394. https://doi.org/10.1111/2041-210x.70147
11. Ransome, E., Geller, J. B., Timmers, M., Leray, M., Mahardini, A., Sembiring, A., Collins, A. G., & Meyer, C. P. (2017). The importance of standardization for biodiversity comparisons: A case study using autonomous reef monitoring structures (ARMS) and metabarcoding to measure cryptic diversity on Mo’orea coral reefs, French Polynesia. PLOS ONE, 12(4), e0175066. https://doi.org/10.1371/journal.pone.0175066
12. Vu, D., Groenewald, M., Vries, M. de, Gehrmann, T., Stielow, B., Eberhardt, U., Al-Hatmi, A., Groenewald, J. Z., Cardinali, G., Houbraken, J., Boekhout, T., Crous, P. W., Robert, V., & Verkley, G. J. M. (2019). Large-scale generation and analysis of filamentous fungal DNA barcodes boosts coverage for kingdom fungi and reveals thresholds for fungal species and higher taxon delimitation. Studies in Mycology, 92(1), 135–154. https://doi.org/10.1016/j.simyco.2018.05.001
13. Timmers, M. A., Vicente, J., Webb, M., Jury, C. P., & Toonen, R. J. (2020). Sponging up diversity: Evaluating metabarcoding performance for a taxonomically challenging phylum within a complex cryptobenthic community. Environmental DNA, 4(1), 239–253. https://doi.org/10.1002/edn3.163
14. Tedersoo, L., Mikryukov, V., Anslan, S., Bahram, M., Khalid, A. N., Corrales, A., Agan, A., Vasco-Palacios, A.-M., Saitta, A., Antonelli, A., Rinaldi, A. C., Verbeken, A., Sulistyo, B. P., Tamgnoue, B., Furneaux, B., Ritter, C. D., Nyamukondiwa, C., Sharp, C., Marín, C., … Abarenkov, K. (2021). The Global Soil Mycobiome consortium dataset for boosting fungal diversity research. Fungal Diversity, 111(1), 573–588. https://doi.org/10.1007/s13225-021-00493-7
15. Kim, M., Oh, H.-S., Park, S.-C., & Chun, J. (2014). Towards a taxonomic coherence between average nucleotide identity and 16S rRNA gene sequence similarity for species demarcation of prokaryotes. International Journal of Systematic and Evolutionary Microbiology, 64(Pt_2), 346–351. https://doi.org/10.1099/ijs.0.059774-0